WATER QUALITY
Temperature
Stream temperature is affected by air temperature, sun exposure, groundwater, and changes to vegetation surrounding the water. Fish and wildlife need cooler streams to thrive. In Oregon, the ideal temperature for rearing salmon and trout is below 64.4°F, but for the majority of the summer, Johnson Creek’s mainstem and tributaries exceed that 64.4° threshold. (One of JCWC’s main goals is to reduce stream temperatures through restoration work such as creekside tree and shrub plantings.) In the map below, areas in red had particularly high temperatures.
Dissolved Lead
In adults and children, lead exposure causes health problems such as damage to the nervous system, learning disabilities, and impaired hearing. Lead reaches urban waterways from soils that contain lead contamination, from automobiles, from industrial sources, and through sewers that contain lead components. In the Johnson Creek Watershed, concentrations of dissolved lead are generally acceptable and are not a human health concern. On the map below, green dots indicate no health concern from lead.
Dissolved Zinc
Dissolved zinc is a concerning pollutant in urban waterways. It comes from the production of brass, bronze, automobile parts, and some common herbicides. It can be toxic to algae, bacteria, and invertebrates. The majority of samples collected in the watershed from 2009-2014 met or were below the “good” dissolved zinc concentration threshold, shown in green in the map below.
Total Suspended Solids
Total suspended solids (TSS) are particles larger than 2 microns that are found in the water column; TSS is thus a measure of water quality and clarity. Particles can include sediments, organic matter, algae and plankton. Water high in TSS is called turbid, and has a reduced amount of light available to aquatic plants, which can affect stream functioning. In the Johnson Creek Watershed, total suspended solids vary with weather patterns and with geographic location.
Total Mercury
Mercury is toxic to wildlife and humans. At high levels it can cause harm to the brain, heart, kidneys, lungs, and immune system. Mining activities and fossil fuel emissions from coal-burning power plants are the biggest sources of mercury. In the Johnson Creek Watershed, mercury concentrations tend to be high: On the map below, red represents Poor and yellow represents Fair, as measured against EPA standards.
Dissolved Copper
Dissolved copper is a pollutant to waterways that can come from sources related to industry and automobile traffic. It can be toxic to algae, bacteria, and aquatic invertebrates. It is generally in an acceptable range in the Johnson Creek Watershed.
E. coli
E. coli are bacteria found widely in animals, including humans. Often used as an indicator of bacteria levels in water bodies, measuring E. coli is often seen as a way to measure human-caused bacteria issues such as the presence of raw sewage. However, E. coli is also somewhat unreliable as a proxy: High concentrations may come from wildlife as well as humans, and E. coli can live for long periods in the water, outside of animal or human hosts. With those caveats in mind, E. coli concentrations in the Johnson Creek mainstem do appear to be high, and undoubtedly human sources are one of the (many) culprits. In the map below, red indicates high concentrations.
Macroinvertebrate Communities
Biological communities make great indicators of watershed conditions, because organisms often live in streams throughout the year. Other monitoring, such as for temperature or mercury, often only captures conditions at the time data are collected. The presence of organisms such as aquatic insects and freshwater mussels can help us understand year-round conditions, and whether those conditions are favorable.
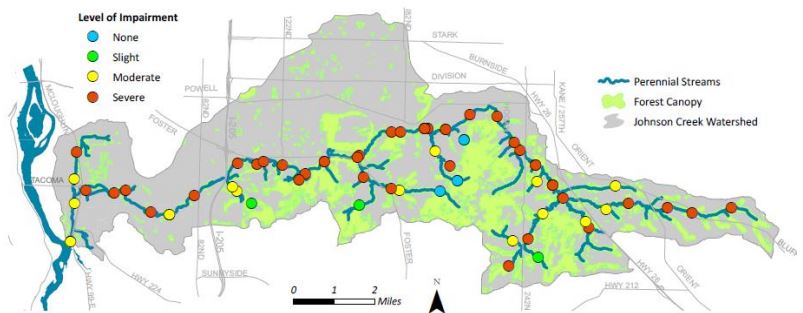
Macroinvertebrates–animals without backbones that are large enough to see with the naked eye–are especially useful water quality indicators. Certain groups, such as the larvae of stoneflies and many mayflies, can only survive in pristine conditions, while other groups, such as leeches, scuds, and black fly larvae, are hardy and found in both pristine and degraded streams. In the Johnson Creek Watershed, the macroinvertebrate community is highly degraded in the mainstem and in many of the tributaries–only only the hardiest![]() invertebrates are found there (shown in red below). A few headwater areas have healthy communities (shown in blue and green).
invertebrates are found there (shown in red below). A few headwater areas have healthy communities (shown in blue and green).
Data Sources
The data above come from several different agencies that regularly monitor the Johnson Creek Watershed. The table shows which agencies collect which data. To request more data or more information, scroll down to find contact information for each agency.
East Multnomah Soil & Water Conservation District
East Multnomah Soil & Water Conservation District (EMSWCD) monitors water quality throughout Johnson Creek in order to establish baselines for the parameters they monitor. Their sampling program is currently focused on collecting enough data for a trend analysis. EMSWCD collects samples monthly at 5 sites in upper Johnson Creek. They collect grab samples on a long list of parameters including total suspended sediment and E. coli. In collaboration with the Johnson Creek Interjurisdictional Committee, EMSWCD installs continuous temperature loggers each summer and assists in annual macroinvertebrate monitoring. For additional information on EMSWCD’s water quality monitoring program, contact Julie DiLeone: JulieD@emswcd.org.
Johnson Creek Inter-Jurisdictional Committee
The Johnson Creek Inter-Jurisdictional Committee (IJC) is a group of scientists who meet monthly to strategize about monitoring and restoration in Johnson Creek. The committee’s members hail from the many agencies that work in Johnson Creek; participating agencies include JCWC; Multnomah County; Clackamas County Water Environment Services; the Cities of Gresham, Portland, and Milwaukie; East Multnomah Soil and Water Conservation District; Metro; Oregon Department of Environmental Quality; Oregon Department of Agriculture; and the U.S. Geological Survey. Each summer, the IJC coordinates participants’ efforts in temperature monitoring, so that this monitoring can be conducted systematically rather than piecemeal. Each August, IJC members participate in a one-day macroinvertebrate sampling effort. The temperature and macroinvertebrate data help all participating agencies to understand the health of the watershed and strategize about future restoration efforts. For more information on the IJC, contact Torrey Lindbo: Torrey.Lindbo@greshamoregon.gov, 503-618-2405.
Gresham Environmental Services
Gresham Environmental Services monitors water quality in the Johnson Creek Watershed at the upstream and downstream ends of where major streams enter and leave Gresham. Through this monitoring, they are able to determine whether the water quality changes as it flows through the city. Grab samples are collected quarterly on a long list of parameters. Each summer, Gresham Environmental Services installs continuous temperature loggers at numerous locations; macroinvertebrate sampling is also done each summer. For more information on Gresham Environmental Services’ monitoring program, visit their website or contact the program coordinator Katie Holzer: Katie.Holzer@greshamoregon.gov, 503-618-2377.
Oregon Department of Environmental Quality
Oregon Department of Environmental Quality (DEQ) has several monitoring programs, with parameters that differ dependent on each program’s objectives. For instance, DEQ has a statewide ambient monitoring network for long-term trending analyses. Oregon DEQ collects both continuous and grab sample data, again depending on the project and parameter. Their long list of parameters includes temperature, total suspended solids, and E. coli.
For more information about Oregon DEQ’s water quality monitoring programs visit their website or contact them at 503-693-5700.
Portland Bureau of Environmental Services
Portland Bureau of Environmental Services (BES) collects data on a long list of parameters including all of those briefly summarized above in the Water Quality webpage. Portland BES uses a spatially-balanced random selection approach called a generalized random-tessellation stratified design to choose their water quality sampling locations. They adjust monitoring frequency according to parameter. A full list of parameters, as well as the full monitoring protocol on which their program is based, can be found here.
To request data from BES, a public records request must be filled out here. To learn more about the program or data, contact Chris Prescott: Chris.Prescott@portlandoregon.gov, 503-823-7089.
United States Geological Survey
The United States Geological Survey (USGS) currently manages six streamflow gages across Johnson Creek at sites that were chosen in agreement with cooperators who fund the sites. The primary Johnson Creek streamflow sites collect both streamflow and temperature; two sites also collect turbidity. All the instream data collected by the USGS are collected using continuous loggers (at 15 minute intervals) and are checked against calibrated field units. To learn more about the water quality data that the USGS collects, contact Adam Stonewall: Stonewal@usgs.gov.


